$CHPY Unpacked: The Income Engine Behind Wall Street's Most Unusual ETF
What you're actually buying when you buy CHPY, where the income comes from, and the trade-off that gets you there.

CHPY (CHPY 0.00%↑) has shown up on Blossom recently because of ONE number. The distribution yield is a whopping 30% annualized, paid out in weekly cash deposits to anyone who holds the fund. For an investor used to seeing S&P 500 dividend yields near 1.3%, that’s a number that demands an explanation.
This article is that explanation. What the fund actually does. Where the 30% yield really comes from. Who it might suit. Who it probably doesn’t.
QUICK ORIENTATION
CHPY = YieldMax Semiconductor Portfolio Option Income ETF. Issuer: YieldMax (Tidal Investments). Inception: April 2, 2025. Listed: NYSE Arca. AUM: roughly $600M. Expense ratio: 1.03% per year. Distribution frequency: weekly.
What CHPY actually owns
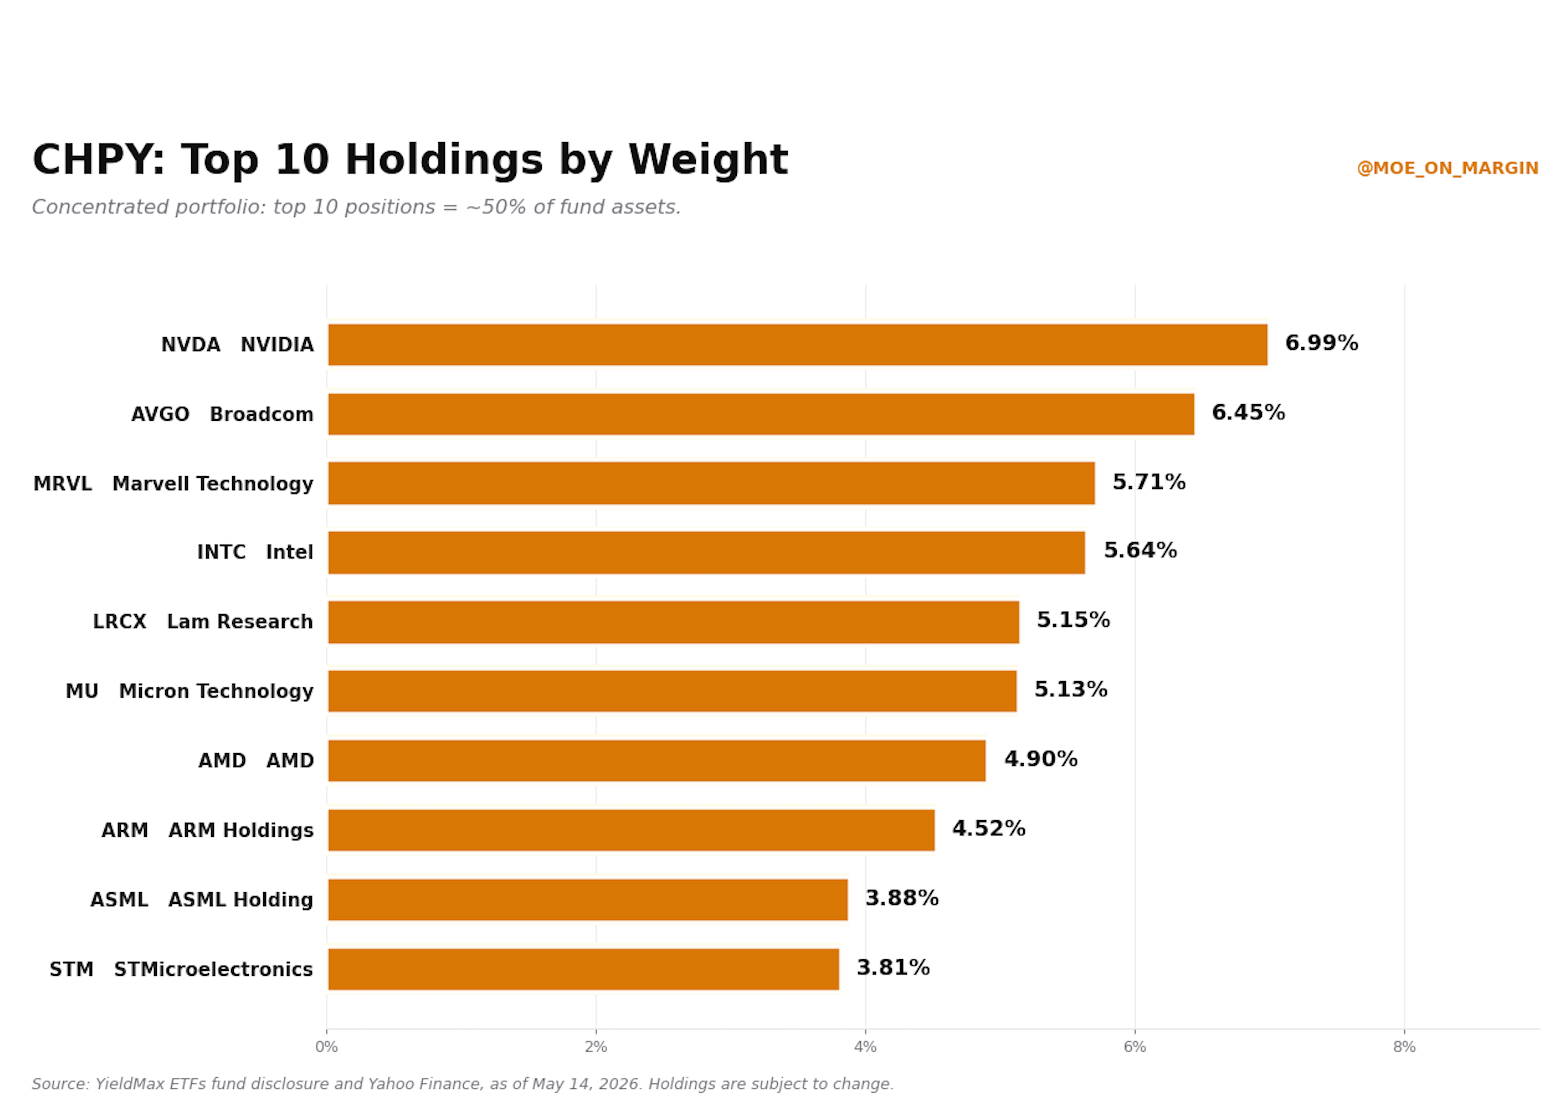
The fund holds 15 to 30 large US-listed semiconductor stocks. The top 10 positions make up about half the total assets. As of mid-May 2026, the largest holdings are NVIDIA, Broadcom, Marvell Technology, Intel, Lam Research, ARM Holdings, AMD, ASML, KLA Corporation, and Micron.
ONE NUMBER WORTH UNPACKING
If you look up CHPY on Robinhood, StockAnalysis, or most data aggregators, the holdings count comes back at roughly 97 positions. That figure is technically correct but needs context.
The 97 number counts every line item in the fund’s holdings table — including the 78 individual options contracts the fund uses to execute its covered call spread strategy. The underlying equity exposure is to about 25 semiconductor companies, which the prospectus describes as a target range of 15 to 30.
If you own CHPY, you own a piece of the largest US semiconductor manufacturers and equipment makers, plus a small amount of cash and short-term Treasuries used as collateral for the options strategy. That equity ownership is the first piece of what the fund does. The income generation is the second piece, and it’s where the strategy gets interesting.
Where the yield actually comes from
NVIDIA pays a dividend yield of roughly 0.03%. Broadcom pays about 1%. Marvell, AMD, and Intel each pay between 0% and 2%. The actual dividend income from the semiconductor stocks CHPY holds is, in aggregate, less than 1% of the fund’s value per year.
The 30% yield is not coming from those companies. It is coming from option premiums or money paid by other market participants in exchange for the right to buy CHPY’s stocks at higher prices in the future. The detailed strategy follows in the next section.
The strategy: covered call spreads
CHPY systematically sells call options on its holdings to collect option premium income. The specific structure is called a covered call spread, and it works like this.
The fund owns NVIDIA stock, for example. It sells a call option on NVIDIA at one strike price, collecting a premium from whoever buys that call. At the same time, the fund buys a call option on NVIDIA at a higher strike price, paying a smaller premium. The difference between the premium collected and the premium paid is net income for the fund.
Let’s Illustrate how that works with an example on Nvidia
Scenario 1 - If NVIDIA stays below the short call strike at expiration say $200:
Both options expire worthless and the fund keeps the net premium as pure income.
Scenario 2 - If NVIDIA closes between $200 and the long call strike of $220:
The fund's upside on the stock gets capped at $200. The short call gets assigned; the long call expires worthless. The gains in that middle band are what the fund effectively trades away for the option premium income.
Scenario 3 - If NVIDIA closes above $220:
The long call also becomes valuable, and the fund participates in the rally dollar-for-dollar from that strike onward.
Now, multiply that by 15 to 30 semiconductor stocks, repeated systematically week after week, and you get the income engine that produces CHPY’s distributions. It is actually an extremely smart and capital-efficient strategy specially on high volatility stocks like semiconductors, where the underlying can move sharply.
WHY A SPREAD INSTEAD OF A PLAIN COVERED CALL
A plain covered call would leave the fund missing the entire rally if NVIDIA ripped 50% — it would have to deliver shares at the short call strike and watch the rest of the move happen to someone else.
The long call leg in the spread restores upside above the higher strike. The fund only gives up gains in the band between the two strikes. The trade-off is less premium collected, since some of what the fund earns on the short call pays for the long call.
The yield, week by week
The headline number on CHPY is obviously the thumb stopping 30% annualized distribution yield. At a share price near $73 in mid-May 2026, with about $23 per share paid in distributions over the trailing twelve months, the yield works out to roughly 30 to 32 percent.
That number is real, but it isn’t a fixed yield. Each weekly distribution is calculated based on the option income the fund generated that week. When implied volatility on semis is high and the fund collects more premium, the weekly payout goes up. When volatility falls and premium collection drops, the weekly payout falls too.
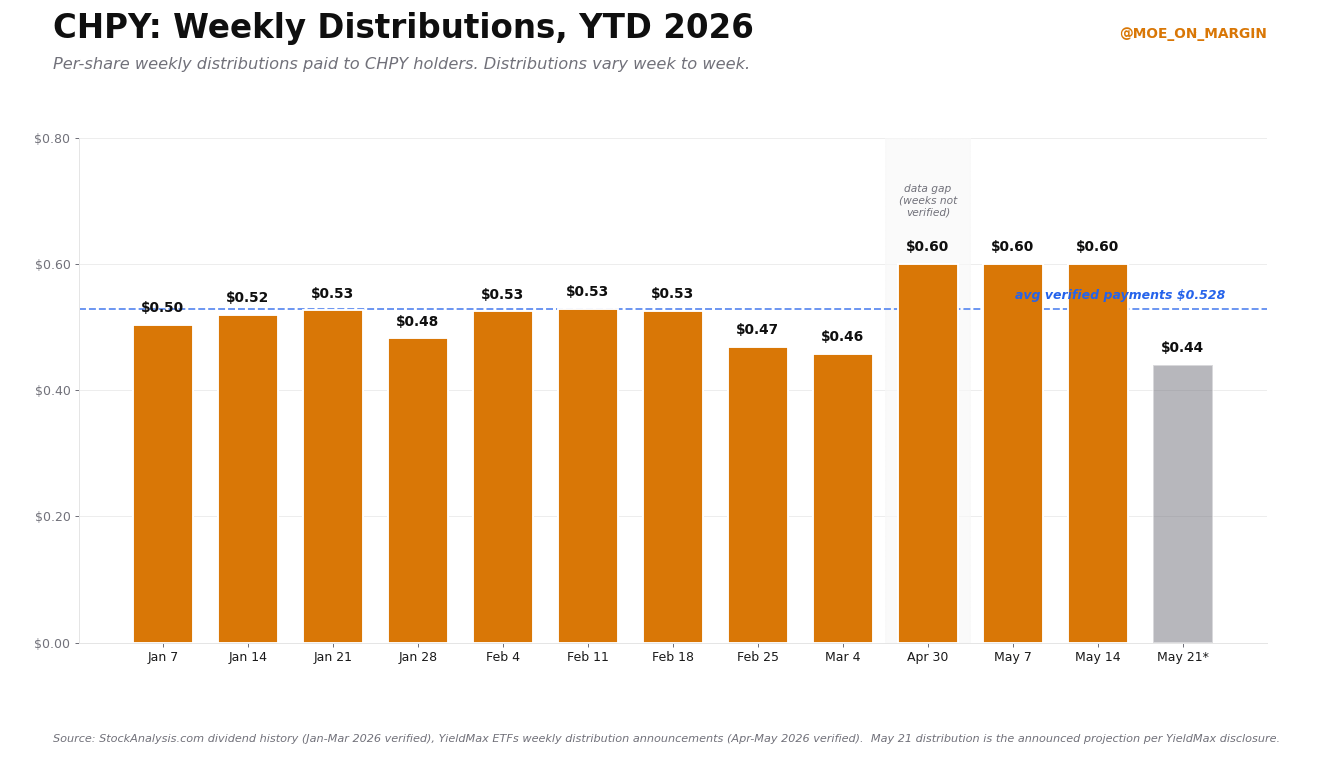
The pattern shows up clearly in 2026. The first nine weeks of the year saw weekly payments range from $0.46 to $0.53 — averaging around $0.51 per share. By late April and early May, the weekly distributions had risen to $0.60. The announcement for the May 21 distribution was $0.44 — a roughly 27% drop from the prior three weeks.
Across a full year, those weekly payments compound to a number around $23 per share at recent run-rates. But the week-to-week variance is real, and an investor counting on a steady fixed weekly check is misreading what the fund does. The check is variable and sometimes meaningfully variable. That still places this ETF as one of the highest income ETFs on the market nonetheless.
The trade-off
In a sideways or slowly-rising market, the trade-off works well for CHPY holders. The fund collects premium, the stocks don’t move much past the strike prices, the options expire worthless, and shareholders pocket the income.
In a strong bull market for semiconductors, CHPY underperforms direct ownership of the same stocks. The fund’s gains get capped at the short call strikes, even as the underlying stocks keep rallying. The income partially offsets the missed upside, but only partially.
In a sharp decline, the income offsets some of the loss but doesn’t eliminate it. The fund still owns the underlying semiconductor stocks, which lose value if the sector sells off. The option premium collected provides a buffer, not a hedge.
This is the structural feature of any options-income ETF. You get cash now in exchange for giving up potential gains later. This is very important to understand with CHPY as it acts very differently in rallies or major down turns compared to other Semiconductors ETFs like SOXX (SOXX 0.00%↑) or SMH (SMH 0.00%↑).
Return of capital and NAV
Every weekly CHPY distribution has to come from somewhere inside the fund. There are three possible sources, and the mix between them is the most important thing to understand about how funds like this work over time.
Source 1 - Option premium income. The fund sold call spreads that week, collected cash from the buyers, and is passing that cash to you. This is real income, money that came into the fund from outside parties. Distributing it doesn’t reduce what’s inside the fund.
Source 2 - Dividends from the underlying stocks. NVIDIA, Broadcom, and the rest of the holdings paid dividends to the fund. The fund passes them through. Also real income, though it’s a very small piece of CHPY’s distributions because semiconductor companies pay tiny dividends.
Source 3 - Return of capital. The fund didn’t generate enough income that week to cover the planned distribution. So instead, the fund sells some of its own assets or pays out of cash reserves and labels the shortfall as return of capital. This is the part where the fund is literally giving you back money you originally invested.
The yield in the second case is technically real, but mechanically it was a withdrawal from your own account. In practice, distributions are usually a mix of all three sources. The fund’s annual tax statement (the 1099-DIV) tells you the breakdown after the fact.
This is the reason older YieldMax funds — particularly single-name covered call funds like TSLY, NVDY, and MSTY — have seen their share prices drift down over time even while paying out big distributions. In years when implied volatility dropped and option premiums shrank, the funds kept paying out anyway. The difference came out of capital. NAV ground lower with every distribution it couldn’t fully earn.
CHPY's distributions have in some cases included substantial return of capital throughout 2026, YieldMax itself reports that 100% of the May 15, 2026 distribution was estimated to be return of capital, and the March 5, 2026 distribution was 89.68% ROC. Despite this, the fund's share price has still risen from around $50 at launch to $73 today because the underlying semiconductor stocks have rallied hard enough since its launch in April 2025 to offset the capital drawdowns.
The real question is what happens when semiconductors aren't rallying?
Well, there are only 2 answers to that question:
The fund will either cut distributions, or
Pay the difference as return of capital and let share value drift down.
Tax treatment
NOT TAX ADVICE
What follows is a general explanation of how distributions from a fund like CHPY are typically treated. I’m not a tax advisor, and tax treatment can vary based on your account type, income bracket, state of residence, and individual circumstances. For your specific situation, talk to a qualified tax professional before making decisions.
Option premium income is generally taxed as ordinary income not at the lower qualified dividend rate and for a high-income investor, this matters.
Return of capital distributions, as noted, aren't taxed when received but reduce your cost basis. When you eventually sell, the gain (or smaller loss) gets taxed at capital gains rates.
For most investors, CHPY is significantly more tax-efficient inside a tax-advantaged account — a traditional IRA, Roth IRA, or HSA — than in a regular brokerage account.
Who CHPY might suit best
Income-focused investors who specifically want high current cash payouts and are comfortable giving up some sector upside to get it.
Investors who want semiconductor sector exposure but prefer cash distributions over capital appreciation.
Tax-advantaged account holders - Roth IRA, traditional IRA, HSA - where the tax inefficiency of ordinary-income distributions is neutralized.
The bottom line
CHPY is an income tool and it does exactly what it says it does. The 30% yield is real, the strategy is well-defined, and the fund delivers weekly cash distributions that range from about $0.44 to $0.60 per share based on what option premium it collects that week.
The yield does not come from nowhere. It comes from systematically converting the upside in semiconductor stocks into current cash income.
For investors who understand the mechanics and want the income profile, CHPY is a legitimate tool in the right portfolio context. For investors who see “30% yield” and assume that’s free money on top of normal stock returns, the eventual experience will probably be disappointing.
The thing to understand is not the yield number. It’s where the yield comes from, and what gets given up to produce it.
Now you have both.
If you enjoyed the article please subscribe for free to get access to future articles.
Disclaimer. This article is for educational purposes only and does not constitute investment advice. Data is sourced from the YieldMax ETFs fund disclosure pages, Yahoo Finance, StockAnalysis.com dividend history, and YieldMax weekly distribution announcements.
Distribution amounts, holdings weights, expense ratios, and prices reflect the most recent data available as of May 19, 2026, and will vary in real time. Options-based income ETFs involve unique risks including return of capital distributions that reduce cost basis, NAV erosion over time, capped upside participation, sector concentration, and complex tax treatment. Past performance is not indicative of future results. Always consult a qualified financial advisor and read the fund's prospectus before investing.